Interactive Matplotlib Figures#
Specify the interactive Jupyter matplotlib backend, backed by ipympl. This must be run first, before any figures are created.
%matplotlib widget
Creating a new figure display an interactive canvas in Jupyter Lab.
If we do nothing else, this will display a snapshot of the currently-blank canvas in the rendered HTML documentation. To avoid that, we edit the Markdown file so that the cell below has the tag hide-output. This places the figure in an expandable box, hidden by fault. Alternatively, we could use remove-output to fully remove it.
```{code-cell} ipython3
:tags: [hide-output]
import matplotlib.pyplot as plt


plt.plot([1,2,3])
```
import matplotlib.pyplot as plt

plt.figure()
Show code cell output
<Figure size 640x480 with 0 Axes>
Plotting data to an existing figure updates the original interactive canvas in Jupyter Lab. Users can scroll up to pan and zoom.
To show an updated snapshot in the rendered HTML documentation, we should call plt.gcf() to display the current Figure.
Caution
If you re-render the canvas—such as by displaying plt.gcf().canvas—that will cause the cached snapshot of the figures above to update to show the latest version of the figure, ruining the sequential narrative in the rendered HTML documentation.
This is due to a detail of the matplotlib–Jupyter interaction. Just know to use plt.gcf() to safely show snapshots.
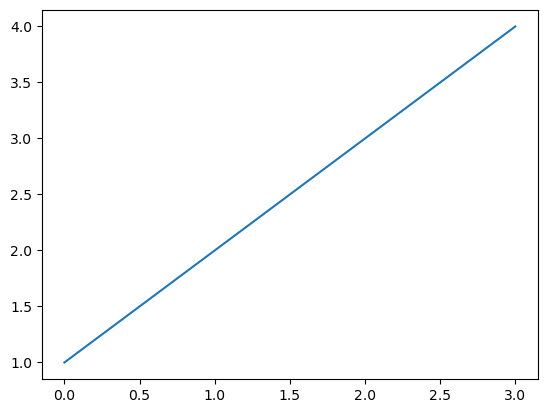
plt.plot([1, 2, 3, 4])
[<matplotlib.lines.Line2D at 0x7f027848bef0>]
plt.gcf()
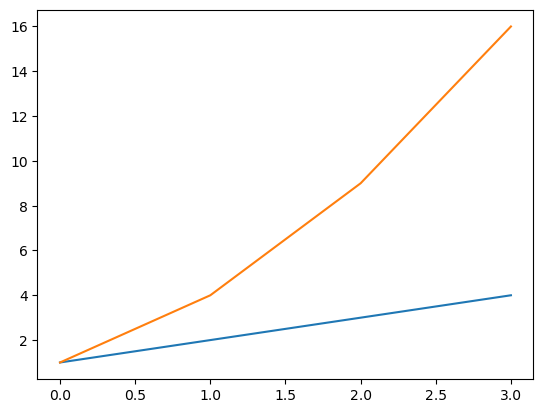
plt.plot([1, 4, 9, 16])
plt.gcf()